This article has been indexed from Security Boulevard
This post is an update to a previous research post authored by ShiftLeft’s Chief Scientist, Fabian Yamaguchi (https://blog.shiftleft.io/beating-the-owasp-benchmark-24a7b1601031). In the last article, he evaluated ShiftLeft’s static analysis tool against the OWASP Benchmark. ShiftLeft’s tool achieved a true-positive rate of 100% and a false-positive rate of 25%, making it the best-in-class SAST tool in terms of benchmark score. He also explains how we achieved the score using our unique information flow approach.
But it is often hard to replicate scores claimed by vendors. So today, we present a way to benchmark ShiftLeft’s tool by yourself. Our team has built in the OWASP Benchmark as a demo app on our platform that you can run in just a few clicks.
This post is co-authored by Fabian Yamaguchi, Katie Horne, Chetan Conikee, Hubert Plociniczak, Malte Kraus, and Olof-Joachim Frahm.
Measuring the success of a security tool
Developers today are constantly pushing out code as we as an industry move towards continuous delivery. As the amount of code written and deployed increases, so does the demand for automation in security. Most of the time, we use static analysis testing to automate finding vulnerabilities in code.
There are the basic factors you’ll need to consider when evaluating a static application security testing (SAST) tool, such as language compatibility, ease of use, and cost. However, once these criteria are met, how do you determine which one is the most accurate?
The OWASP Benchmark Project is a Java test suite designed to evaluate the accuracy of vulnerability detection tools. It is a sample application seeded with thousands of actual instances and false positives of vulnerabilities from 11 categories. You can see how accurate a tool is by its position on the OWASP Benchmark scorecard.
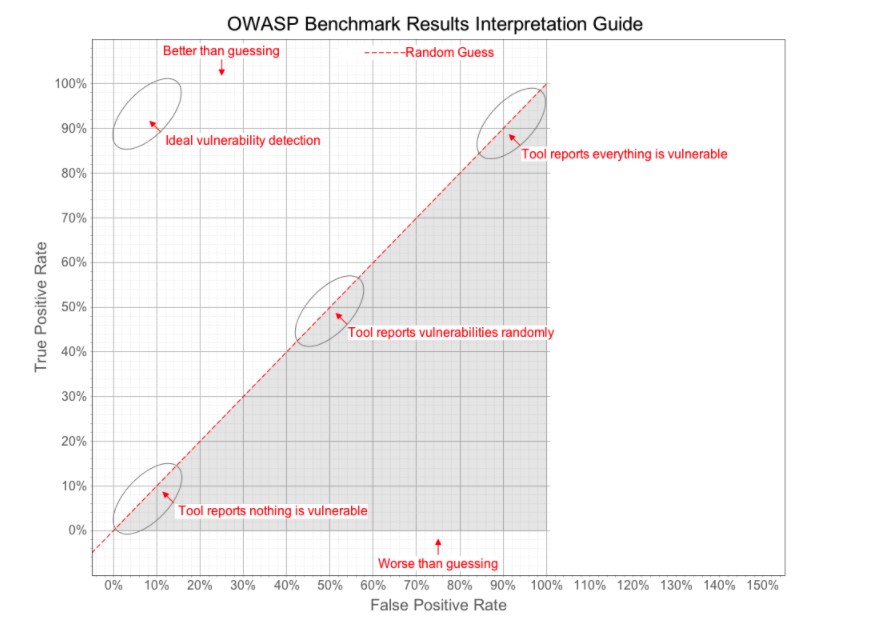
The OWASP benchmark “score” is calculated using Beating the OWASP Benchmark