This article has been indexed from Errata Security
I’m trying to create perfect screen captures of SDR to explain the world of radio around us. In this blogpost, I’m going to discuss some of the imperfect captures I’m getting, specifically, some notes about WiFi and Bluetooth.
An SDR is a “software defined radio” which digitally samples radio waves and uses number crunching to decode the signal into data. Among the simplest thing an SDR can do is look at a chunk of spectrum and see signal strength. This is shown below, where I’m monitoring part of the famous 2.4 GHz pectrum used by WiFi/Bluetooth/microwave-ovens:
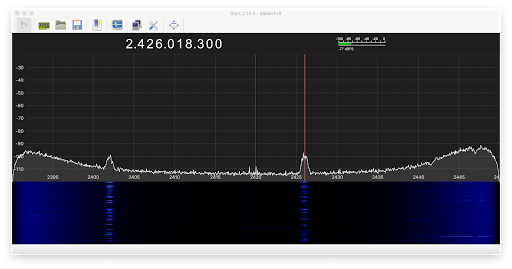
There are two panes. The top shows the current signal strength as graph. The bottom pane is the “waterfall” graph showing signal strength over time, display strength as colors: black means almost no signal, blue means some, and yellow means a strong signal.
The signal strength graph is a bowl shape, because we are actually sampling at a specific frequency of 2.42 GHz, and the further away from this “center”, the less accurate the analysis. Thus, the algorithms think there is more signal the further away from the center we are.
What we do see here is two peaks, at 2.402 GHz toward the left and 2.426 GHz toward the right (which I’ve marked with the red line). These are the “Bluetooth beacon” channels. I was able to capture the screen at the moment some packets were sent, showing signal at this point. Below in the waterfall chart, we see packets constantly being sent at these frequencies.
We are surrounded by devices giving off packets here: our phones, our watches, “tags” attached to devices, televisions, remote controls, speakers, computers, and so on. This is a picture from my home, showing only my devices and perhaps my neighbors. In a crowded area, these two bands are saturated with traffic.
The 2.4 GHz region also includes WiFi. So I connected to a WiFi access-point to watch the signal.